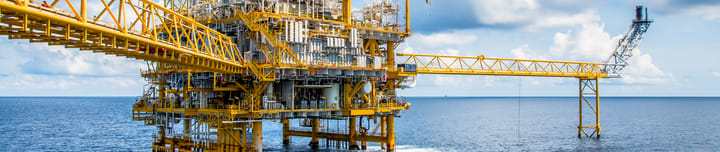
Hong Kong (HSI) Oil and Gas Exploration and Production Industry Analysis
UpdatedMay 25, 2024
DataAggregated Company Financials
Companies9
- 7D1.3%
- 3M19.9%
- 1Y52.8%
- YTDn/a
Over the last 7 days, the Oil and Gas Exploration and Production industry has dropped 1.6%, driven by CNOOC declining 2.6%. Meanwhile, China Huarong Energy actually outperformed within the industry, gaining 34% in the last week. Over the past 12 months, the industry was up 46%. In the next few years earnings are forecast to be pretty stable.
Industry Valuation and Performance
Has the Hong Kong Oil and Gas Exploration and Production Industry valuation changed over the past few years?
| Date | Market Cap | Revenue | Earnings | PE | Absolute PE | PS |
|---|---|---|---|---|---|---|
| Sat, 25 May 2024 | HK$984.9b | HK$479.4b | HK$140.1b | 10.5x | 7x | 2.1x |
| Mon, 22 Apr 2024 | HK$945.2b | HK$465.9b | HK$132.3b | 8.8x | 7.1x | 2x |
| Wed, 20 Mar 2024 | HK$900.2b | HK$467.0b | HK$141.2b | 9.3x | 6.4x | 1.9x |
| Fri, 16 Feb 2024 | HK$739.3b | HK$471.9b | HK$142.8b | 8.6x | 5.2x | 1.6x |
| Sun, 14 Jan 2024 | HK$701.8b | HK$472.2b | HK$143.1b | 7.2x | 4.9x | 1.5x |
| Tue, 12 Dec 2023 | HK$648.3b | HK$470.5b | HK$142.6b | 6.7x | 4.5x | 1.4x |
| Thu, 09 Nov 2023 | HK$665.3b | HK$464.8b | HK$143.1b | 5.4x | 4.6x | 1.4x |
| Sat, 07 Oct 2023 | HK$697.4b | HK$458.0b | HK$146.2b | 5.4x | 4.8x | 1.5x |
| Mon, 04 Sep 2023 | HK$699.3b | HK$461.4b | HK$147.3b | 5.5x | 4.7x | 1.5x |
| Wed, 02 Aug 2023 | HK$668.8b | HK$483.2b | HK$154.8b | 4.9x | 4.3x | 1.4x |
| Fri, 30 Jun 2023 | HK$589.2b | HK$481.2b | HK$154.1b | 4.7x | 3.8x | 1.2x |
| Sun, 28 May 2023 | HK$658.4b | HK$492.5b | HK$157.8b | 4.4x | 4.2x | 1.3x |
| Tue, 25 Apr 2023 | HK$633.0b | HK$497.5b | HK$164.8b | 3.8x | 3.8x | 1.3x |
| Thu, 23 Mar 2023 | HK$577.1b | HK$453.3b | HK$147.6b | 5.6x | 3.9x | 1.3x |
| Sat, 18 Feb 2023 | HK$577.8b | HK$453.0b | HK$147.3b | 4.9x | 3.9x | 1.3x |
| Mon, 16 Jan 2023 | HK$534.0b | HK$462.4b | HK$150.4b | 4.5x | 3.5x | 1.2x |
| Wed, 14 Dec 2022 | HK$511.9b | HK$443.2b | HK$144.1b | 4.6x | 3.6x | 1.2x |
| Fri, 11 Nov 2022 | HK$518.4b | HK$430.8b | HK$140.5b | 4.5x | 3.7x | 1.2x |
| Sun, 09 Oct 2022 | HK$516.6b | HK$388.5b | HK$123.8b | 4.7x | 4.2x | 1.3x |
| Tue, 06 Sep 2022 | HK$556.7b | HK$400.3b | HK$127.7b | 4.2x | 4.4x | 1.4x |
| Thu, 04 Aug 2022 | HK$499.0b | HK$343.8b | HK$106.4b | 10.1x | 4.7x | 1.5x |
| Sat, 02 Jul 2022 | HK$535.4b | HK$346.0b | HK$107.2b | 8.5x | 5x | 1.5x |
| Mon, 30 May 2022 | HK$622.4b | HK$347.7b | HK$107.0b | 9.4x | 5.8x | 1.8x |
| Wed, 27 Apr 2022 | HK$504.6b | HK$308.7b | HK$85.9b | 9.8x | 5.9x | 1.6x |
| Fri, 25 Mar 2022 | HK$503.2b | HK$247.2b | HK$60.1b | 11.2x | 8.4x | 2x |
| Sun, 20 Feb 2022 | HK$488.1b | HK$248.2b | HK$60.3b | 8.6x | 8.1x | 2x |
| Tue, 18 Jan 2022 | HK$456.4b | HK$246.8b | HK$60.0b | 7.1x | 7.6x | 1.8x |
| Thu, 16 Dec 2021 | HK$378.3b | HK$246.6b | HK$60.0b | 6.2x | 6.3x | 1.5x |
| Sat, 13 Nov 2021 | HK$400.4b | HK$245.5b | HK$59.7b | 14.3x | 6.7x | 1.6x |
| Mon, 11 Oct 2021 | HK$441.8b | HK$243.4b | HK$59.1b | 17.1x | 7.5x | 1.8x |
| Wed, 08 Sep 2021 | HK$392.2b | HK$242.3b | HK$58.9b | 13.8x | 6.7x | 1.6x |
| Fri, 06 Aug 2021 | HK$405.5b | HK$242.3b | HK$58.9b | 13.9x | 6.9x | 1.7x |
Price to Earnings Ratio
9.7x
Current Industry PE
- Investors are optimistic on the Hong Kong Oil and Gas Exploration and Production industry, and appear confident in long term growth rates.
- The industry is trading at a PE ratio of 6.9x which is higher than its 3-year average PE of 5.5x.
- The 3-year average PS ratio of 1.6x is lower than the industry's current PS ratio of 2.0x.
Past Earnings Growth
- The earnings for companies in the Oil and Gas Exploration and Production industry have grown 47% per year over the last three years.
- Revenues for these companies have grown 30% per year.
- This means that more sales are being generated by these companies overall, and subsequently their profits are increasing too.
Industry Comparison
How does Hong Kong Oil and Gas Exploration and Production compare with similar industries?
| HK Market | -3.10% | |
| Energy | 0.67% | |
| Oil and Gas | 0.78% | |
| Oil and Gas Exploration and Production | 1.31% | |
| Coal and Fuels | 1.59% | |
| Integrated Oil and Gas | 0.28% | |
| Oil and Gas Storage and Transportation | -0.14% | |
| Oil and Gas Refining and Marketing | -6.21% | |
Industry PEThere are no additional sub-industries under this industry.
Forecasted GrowthThere are no additional sub-industries under this industry.
Top Stock Gainers and Losers
Which companies have driven the market over the last 7 days?
| Company | Last Price | 7D | 1Y | Valuation | |
|---|---|---|---|---|---|
| 883 CNOOC | HK$19.62 | 1.3% +HK$12.4b | 57.2% | PE6.6x | |
| 1101 China Huarong Energy | HK$0.039 | 25.8% +HK$38.2m | -17.0% | PS2.1x | |
| 353 Energy International Investments Holdings | HK$0.85 | 2.4% +HK$21.6m | 57.4% | PE29.8x | |
| 632 CHK Oil | HK$0.087 | 1.2% +HK$841.6k | -45.6% | PS0.5x |