

Last Update 30 Jun 26
Fair value Decreased 4.66%NEM: Higher Costs And New Projects Will Shape Future Cash Generation
Newmont's analyst price target has been trimmed slightly, with the fair value estimate moving from about $95.85 to $91.38 as analysts factor in updated cost expectations, a modestly softer revenue outlook, and revised long term P/E and margin assumptions following recent research moves that include both small target cuts and fresh Overweight ratings.
Analyst Commentary
Recent Street commentary on Newmont highlights a mix of views, with some analysts trimming price targets and reassessing ratings as they incorporate updated cost expectations, quarter to quarter cadence, and revised long term assumptions into their models.
One research update trimmed a price target for Newmont slightly after stronger than expected Q1 results were offset by expectations for higher costs and a recalibrated outlook for the second half of the year. Other recent updates referenced model changes around diesel prices and operating cost pressures when reassessing the stock.
At the same time, there are also more constructive voices, including new Overweight coverage that set out a fresh valuation framework for Newmont, even as the broader analyst group continues to fine tune targets in light of evolving cost and margin assumptions.
Bearish Takeaways
- Bearish analysts have trimmed Newmont price targets by small increments in multiple updates, indicating a cautious stance on how higher operating costs could affect earnings power and justified valuation multiples.
- Recent downgrades have cited factors such as higher diesel and broader cost pressures, reflecting concern that Newmont may face execution risk if inflation in key inputs persists or tracking of projected cost savings falls short.
- Some price target reductions have followed model revisions around the timing and cadence of results in the second half, which points to concern that Newmont’s growth and margin profile may be less smooth than previously assumed.
- The cluster of bearish adjustments, even if modest in size, highlights a segment of the Street that is more cautious on Newmont’s ability to fully translate its asset base into consistent free cash flow and supports a more conservative stance on valuation and P/E assumptions.
What’s in the News for Newmont
- Newmont secured key regulatory approvals from the Province of British Columbia for the Red Chris Block Cave project, supporting a shift from open pit to block caving, extending mine life into the mid 2040s, and targeting an increase in Canada’s copper production by roughly 15%, with more than 1,800 construction jobs and about 1,500 peak season operating roles expected, according to company and provincial disclosures.
- Analysts covering Newmont are highlighting projections for a 57.34% move in earnings per share and a 16.38% move in revenue in upcoming financial results, alongside mixed stock performance and a range of ratings, including a Zacks Rank #1 (Strong Buy) and Hold views, per Zacks coverage.
- Several research outlets, including Zacks, have flagged Newmont as a value oriented opportunity, citing upward earnings revisions, a reported P/E of 5.76 versus an S&P 500 average of 9.80, and third party Discounted Cash Flow work that characterizes the stock as undervalued by about 32.9% as of mid June 2026.
- Newmont announced executive leadership changes effective July 1, 2026, with Brian Tabolt becoming Chief Financial Officer, Mark Rodgers taking the role of Chief Operating Officer, David Thornton assuming the position of Chief Technical Officer, and David Fry promoted to Executive Vice President, Project Development, according to company statements.
- Newmont’s shares have seen sharp moves around dividend events, including a session where the stock fell more than 6.5% on heavy volume on its ex dividend date, and separate trading days where the stock rose between 5.2% and 5.6% after an earlier 5.9% decline and a drawdown of more than 20% over the prior month, based on reporting from market data services and GuruFocus.
Valuation Changes for Newmont
- Fair Value: trimmed slightly from $95.85 to $91.38, reflecting updated assumptions in the valuation model.
- Discount Rate: adjusted marginally lower from 8.62% to 8.62%, indicating a very small change in the required return used for Newmont.
- Revenue Growth: revised to a slightly softer decline, moving from a 3.98% fall to a 3.81% fall, based on updated expectations.
- Net Profit Margin: raised from 39.98% to 43.51%, pointing to higher modeled profitability for Newmont.
- Future P/E: reduced from 13.61x to 11.86x, implying a lower earnings multiple in the updated valuation work.
Key Takeaways
- Rising regulatory, environmental, and geopolitical hurdles are expected to increase costs, constrain production, and create significant earnings volatility for Newmont.
- Shifting investor preferences and weakening gold demand threaten long-term revenue growth and compress margins due to higher operating and compliance costs.
- Strong gold demand, operational discipline, and portfolio optimization are enhancing efficiency, earnings quality, and financial flexibility, supporting sustainable long-term profitability and shareholder returns.
Catalysts
About Newmont- Engages in the production and exploration of gold properties.
- As global capital allocators intensify their move toward decarbonization and renewable energy, the long-term investment case for physical gold may erode, leading to structurally lower demand for Newmont's primary product and ultimately driving realized gold prices and revenues down over the next decade.
- The aging global population and increasing adoption of digital financial assets are likely to deeply undermine gold's position as a safe-haven store of value, causing a persistent downward pressure on both demand and pricing, which will weigh on Newmont's future revenue and earnings growth.
- Compounded by ongoing depletion of economically viable reserves, Newmont will be forced to develop more lower-grade, higher-cost deposits, leading to a structural rise in all-in sustaining costs, which compresses operating and net margins even in periods of stable or rising metal prices.
- Intensifying regulatory and environmental scrutiny worldwide is expected to dramatically increase permitting and compliance costs, with heightened risk of project cancellations, delays, or asset impairments that will constrain Newmont's ability to sustain or grow production, thus directly impacting both revenue and long-term return on capital.
- Rising geopolitical fragmentation and protectionist policies threaten to disrupt Newmont's ability to efficiently market and export its output, leading to significant earnings volatility and increasing the risk of stranded assets or margin destruction across its global portfolio.
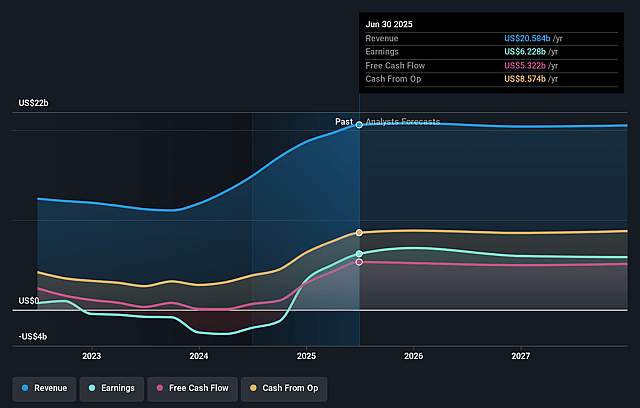
Newmont Future Earnings and Revenue Growth
Assumptions
How have these above catalysts been quantified?
- This narrative explores a more pessimistic perspective on Newmont compared to the consensus, based on a Fair Value that aligns with the bearish cohort of analysts.
- The bearish analysts are assuming Newmont's revenue will decrease by 3.8% annually over the next 3 years.
- The bearish analysts assume that profit margins will increase from 33.9% today to 43.5% in 3 years time.
- The bearish analysts expect earnings to reach $9.7 billion (and earnings per share of $8.17) by about June 2029, up from $8.5 billion today. However, there is some disagreement amongst the analysts with the more bullish ones expecting earnings as high as $19.7 billion.
- In order for the above numbers to justify the price target of the more bearish analyst cohort, the company would need to trade at a PE ratio of 11.9x on those 2029 earnings, which is the same as it is today today. This future PE is lower than the current PE for the US Metals and Mining industry at 21.0x.
- The bearish analysts expect the number of shares outstanding to decline by 2.81% per year for the next 3 years.
- To value all of this in today's terms, we will use a discount rate of 8.62%, as per the Simply Wall St company report.
Risks
What could happen that would invalidate this narrative?- Robust demand for gold remains a secular tailwind, driven by ongoing inflationary pressures, currency debasement, and a supportive macroeconomic environment, all of which could sustain higher gold prices and underpin strong revenues and free cash flow for Newmont.
- Newmont has demonstrated significant operational resilience, delivering record free cash flow of $1.7 billion in the second quarter and maintaining industry-leading cost discipline, with all-in sustaining costs and operational performance consistently meeting or exceeding guidance, which supports future earnings.
- The successful integration of recently acquired high-quality, long-life assets, along with ongoing portfolio optimization and divestiture of non-core assets, is creating a stronger, more focused and geographically diversified production base that enhances return on capital and could lead to higher long-term earnings quality.
- Investments in productivity enhancements, technology, and automation are translating into measurable improvements in mining efficiency and cost reductions across key operations such as Lihir, Boddington, and Cadia, increasing the likelihood of improved net margins and sustainable profitability in coming years.
- Newmont's strong capital allocation discipline-evident in aggressive debt repayment, substantial share buybacks, and consistent dividends-along with a robust balance sheet and substantial cash reserves, gives the company financial flexibility to weather industry downturns, pursue organic growth projects, and continue returning capital to shareholders, thus supporting share price stability or growth.
Valuation
How have all the factors above been brought together to estimate a fair value?
- The assumed bearish price target for Newmont is $91.38, which represents up to two standard deviations below the consensus price target of $140.17. This valuation is based on what can be assumed as the expectations of Newmont's future earnings growth, profit margins and other risk factors from analysts on the more bearish end of the spectrum.
- However, there is a degree of disagreement amongst analysts, with the most bullish reporting a price target of $175.0, and the most bearish reporting a price target of just $72.0.
- In order for you to agree with the more bearish analyst cohort, you'd need to believe that by 2029, revenues will be $22.2 billion, earnings will come to $9.7 billion, and it would be trading on a PE ratio of 11.9x, assuming you use a discount rate of 8.6%.
- Given the current share price of $94.51, the analyst price target of $91.38 is 3.4% lower. The relatively low difference between the current share price and the analyst consensus price target indicates that they believe on average, the company is fairly priced.
- We always encourage you to reach your own conclusions though. So sense check these analyst numbers against your own assumptions and expectations based on your understanding of the business and what you believe is probable.
Have other thoughts on Newmont?
Create your own narrative on this stock, and estimate its Fair Value using our Valuator tool.
Create NarrativeHow well do narratives help inform your perspective?
Disclaimer
AnalystLowTarget is a tool utilizing a Large Language Model (LLM) that ingests data on consensus price targets, forecasted revenue and earnings figures, as well as the transcripts of earnings calls to produce qualitative analysis. The narratives produced by AnalystLowTarget are general in nature and are based solely on analyst data and publicly-available material published by the respective companies. These scenarios are not indicative of the company's future performance and are exploratory in nature. Simply Wall St has no position in the company(s) mentioned. Simply Wall St may provide the securities issuer or related entities with website advertising services for a fee, on an arm's length basis. These relationships have no impact on the way we conduct our business, the content we host, or how our content is served to users. The price targets and estimates used are consensus data, and do not constitute a recommendation to buy or sell any stock, and they do not take account of your objectives, or your financial situation. Note that AnalystLowTarget's analysis may not factor in the latest price-sensitive company announcements or qualitative material.


