

Last Update 24 Jul 26
Fair value Increased 2.82%CB: Earnings Strength And Capital Returns Will Support War Risk Expansion
Analysts have lifted their fair value estimate for Chubb from about $355.83 to roughly $365.87, citing updated assumptions for revenue trends, profit margins, discount rate, and the stock's future P/E multiple.
What’s in the News for Chubb
- Chubb reported Q2 2026 net income of US$2.85b and core operating income of US$2.84b, with core operating income up 18.2% year over year and consolidated net premiums written up 3.6%, driven by 3.0% growth in Property & Casualty and 7.5% growth in Life Insurance, according to recent earnings coverage.
- The Property & Casualty segment recorded underwriting income up 18.8% and a combined ratio of 83.8%. Analysts cited these operating results in recent articles that also flagged a 12.46% share price gain over the past month relative to the Finance sector and S&P 500, per the same coverage.
- Analysts in one report expect Chubb’s Q2 2026 EPS to be in the range of US$6.57 to US$6.60, referencing a recent four quarter pattern of earnings surprises averaging 9.59% and a Zacks Rank #3 (Hold) rating, while characterizing their stance as cautious optimism.
- From April 1, 2026 to June 30, 2026, Chubb repurchased 2,992,237 shares, about 0.77% of its shares, for US$979m. This completed a broader program of 14,811,112 shares, about 3.76%, for US$4,449.36m under the buyback announced on May 15, 2025.
- At the May 21, 2026 Annual General Meeting in Switzerland, shareholders approved a 5.2% increase in the annual dividend to US$4.08 per share, or US$1.02 per share each quarter, marking the 33rd consecutive annual increase. They also renewed the capital band that allows the Board to adjust share capital by up to 20% for one year.
Valuation Changes for Chubb
- Fair Value Estimate raised slightly from $355.83 to $365.87 per share.
- Discount Rate effectively unchanged at about 6.92%.
- Revenue Growth revised to a steeper projected decline from about 5.87% to about 6.80%.
- Profit Margin adjusted lower from about 21.44% to about 20.41%.
- Future P/E increased from about 14.24x to about 16.10x.
Key Takeaways
- Expansion in international markets and specialized insurance, along with digital innovation, is driving strong, diversified revenue and earnings growth.
- A disciplined underwriting strategy, robust capital deployment, and strong cash flow support sustained profitability and flexible shareholder returns.
- Rising competition, loss costs, catastrophe exposure, and regulatory pressures threaten Chubb's profitability and create significant uncertainty for future revenue growth and margins.
Catalysts
About Chubb- Provides insurance and reinsurance products worldwide.
- Strong premium growth in international markets (especially Asia and Latin America), fueled by rising asset ownership, growing middle classes, and increasing insurance penetration, is likely to support durable multi-year revenue expansion and geographic diversification.
- Continued acceleration in digital distribution channels and advanced analytics is enabling more precise risk segmentation and underwriting, especially in consumer and small commercial lines, enhancing both revenue growth and net margin over the long term.
- Chubb's disciplined approach to risk selection and underwriting (walking away from underpriced business, reshaping portfolios) in both U.S. and global markets is preserving industry-leading combined ratios and underpinning sustained net margin performance.
- Capital deployment through ongoing share repurchases (new $5B authorization), growing dividends, and selective M&A is creating upward pressure on earnings per share (EPS), while robust cash flow and capital position provide flexibility for further shareholder returns.
- Growth in specialized insurance demand-such as cyber and high-net-worth personal lines-driven by macro trends (digitalization, greater risk exposures, climate-driven catastrophes), positions Chubb to leverage expertise and scale for above-industry-average topline and earnings growth.
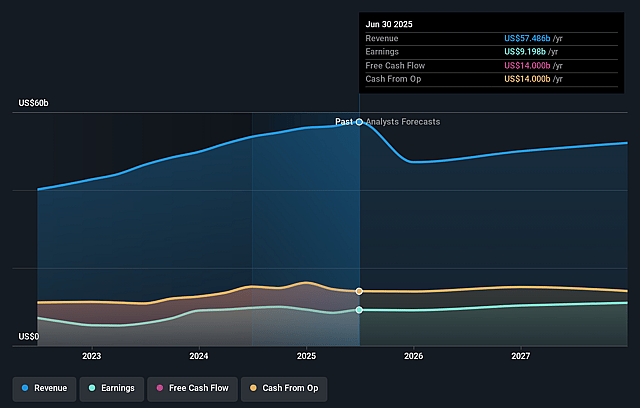
Chubb Future Earnings and Revenue Growth
Assumptions
How have these above catalysts been quantified?
- Analysts are assuming Chubb's revenue will decrease by 6.8% annually over the next 3 years.
- Analysts assume that profit margins will increase from 18.0% today to 20.4% in 3 years time.
- Analysts expect earnings to reach $10.2 billion (and earnings per share of $30.04) by about July 2029, down from $11.2 billion today.
- In order for the above numbers to justify the price target of the analysts, the company would need to trade at a PE ratio of 16.1x on those 2029 earnings, up from 12.4x today. This future PE is greater than the current PE for the US Insurance industry at 12.2x.
- Analysts expect the number of shares outstanding to decline by 1.85% per year for the next 3 years.
- To value all of this in today's terms, we will use a discount rate of 6.92%, as per the Simply Wall St company report.
Risks
What could happen that would invalidate this narrative?- Chubb is facing increasing competition and price softness in large account and property insurance, with rates for large accounts down significantly (e.g., property pricing down 12% in large account business), which could pressure premium revenue growth and net margins if the trend continues or intensifies.
- The persistent and rising costs associated with social inflation and litigation, particularly in casualty and commercial auto lines, are driving loss cost trends well above general inflation (7-9% vs national average), increasing claims expenses and potentially eroding underwriting profitability over time.
- The company is exposed to volatility and execution risk in high-growth emerging markets like Latin America and Asia; while these present growth opportunities, they also carry economic and geopolitical risks that could lead to unpredictable earnings variability and integration challenges impacting long-term revenue and margins.
- Elevated catastrophe losses ($630 million pretax in the quarter) and ongoing exposure to severe weather and natural disaster risk (especially in property lines and high-net-worth personal lines) could increasingly pressure net margins and earnings, particularly as climate trends intensify and reinsurance pricing remains volatile.
- Heightened regulatory scrutiny, litigation developments, and changing liability laws (varying state-by-state in the U.S., with ongoing need for tort reform) increase operational complexity and compliance costs, threatening efficiency and putting long-term pressure on Chubb's expense ratios and net profitability.
Valuation
How have all the factors above been brought together to estimate a fair value?
- The analysts have a consensus price target of $365.87 for Chubb based on their expectations of its future earnings growth, profit margins and other risk factors.
- However, there is a degree of disagreement amongst analysts, with the most bullish reporting a price target of $425.0, and the most bearish reporting a price target of just $306.0.
- In order for you to agree with the analysts, you'd need to believe that by 2029, revenues will be $50.2 billion, earnings will come to $10.2 billion, and it would be trading on a PE ratio of 16.1x, assuming you use a discount rate of 6.9%.
- Given the current share price of $359.75, the analyst price target of $365.87 is 1.7% higher. The relatively low difference between the current share price and the analyst consensus price target indicates that they believe on average, the company is fairly priced.
- We always encourage you to reach your own conclusions though. So sense check these analyst numbers against your own assumptions and expectations based on your understanding of the business and what you believe is probable.
Have other thoughts on Chubb?
Create your own narrative on this stock, and estimate its Fair Value using our Valuator tool.
Create NarrativeHow well do narratives help inform your perspective?
Disclaimer
AnalystConsensusTarget is a tool utilizing a Large Language Model (LLM) that ingests data on consensus price targets, forecasted revenue and earnings figures, as well as the transcripts of earnings calls to produce qualitative analysis. The narratives produced by AnalystConsensusTarget are general in nature and are based solely on analyst data and publicly-available material published by the respective companies. These scenarios are not indicative of the company's future performance and are exploratory in nature. Simply Wall St has no position in the company(s) mentioned. Simply Wall St may provide the securities issuer or related entities with website advertising services for a fee, on an arm's length basis. These relationships have no impact on the way we conduct our business, the content we host, or how our content is served to users. The price targets and estimates used are consensus data, and do not constitute a recommendation to buy or sell any stock, and they do not take account of your objectives, or your financial situation. Note that AnalystConsensusTarget's analysis may not factor in the latest price-sensitive company announcements or qualitative material.
