

Last Update 11 Aug 26
Fair value Decreased 5.08%NEM: Buybacks And Resilient Margins Will Drive Future Upside Potential
Newmont's analyst fair value estimate has shifted from $177 to $168 as analysts factor in updated precious metals price assumptions, slightly lower production expectations, and a higher discount rate, while also recognizing improved profit margins and a lower future P/E profile supported by buybacks and ongoing shareholder returns.
Analyst Commentary
Recent Street research on Newmont shows a mix of target price reductions and reaffirmed positive views, with most of the discussion tied to changing gold and silver price assumptions, cost trends, and the pace of shareholder returns. For investors, the key question is how these updated views feed into Newmont's valuation and what they imply about execution quality and future cash generation potential.
Across multiple reports in 2026, bullish analysts continue to describe Newmont as a company with resilient margins, active capital returns, and a portfolio that can support larger scale over time. While target prices have generally adjusted lower in response to new commodity price and cost forecasts, many ratings remain positive, and several research desks still point to what they see as upside relative to current trading levels.
Analysts frequently tie their Newmont views to changes in gold and silver price assumptions, which affect modeled earnings, cash flow, and net asset value. Some reports also emphasize operational updates, such as production performance at key assets and expectations for corporate and project news flow. Together, these factors shape how the Street is recalibrating its fair value estimates for the stock.
There is also ongoing focus on Newmont's capital allocation. Multiple notes highlight buybacks and broader shareholder returns as central to the investment case. These actions influence P/E outcomes, share count, and the pace at which analysts expect value to accrue to existing shareholders over time.
Bullish Takeaways
- Bullish analysts highlight Newmont's active buyback program and broader returns to shareholders as a key support for per share valuation, even as commodity assumptions are revised.
- Several research desks maintain positive ratings on Newmont despite lower price targets. This signals continued confidence in the company's ability to execute against its production and cost plans.
- Reports referencing strong recent production at assets tied to Newmont point to what bullish analysts see as solid operational follow through. They argue this can underpin cash flow and support the current P/E profile.
- Some bullish analysts view recent share price pullbacks in the gold mining group as creating what they describe as attractive entry setups for higher quality producers like Newmont, particularly given ongoing capital returns and what they see as still healthy margins.
What’s in the News for Newmont
- Newmont and Barrick Mining Corporation agreed to contribute previously excluded properties, including Newmont’s Fiberline and Mike developments and Barrick’s Fourmile, into the Nevada Gold Mines joint venture. The updated agreement resolves all outstanding disputes, adds enhanced governance provisions, and includes a US$1.95b payment from Newmont to Barrick. Source: company announcement and joint venture update.
- Following this resolution, Newmont consented to Barrick’s proposed IPO of its North American gold assets. This offering is tied to the revised Nevada Gold Mines joint venture structure. Source: joint venture agreement disclosure.
- Newmont completed a joint venture agreement with Headwater Gold for the Spring Peak Project in Nevada. Newmont holds a 51% interest after funding US$15,000,000 in exploration and has elected to move to Stage 2, with an option to increase its ownership to 65% by funding an additional US$40,000,000 in exploration over 3 years once the Burnt Rock Plan of Operations is approved. Source: Headwater Gold and Newmont joint venture announcement.
- Newmont reported second quarter 2026 total attributable gold production of 1,293 koz and year to date production of 2,594 koz as of June 30, 2026. Source: Newmont operating results release.
- Newmont announced that Brian Tabolt will become Chief Financial Officer effective July 1, 2026, following prior roles including interim CFO and Chief Accounting Officer. Peter Wexler will return to his full-time role as Executive Vice President and Chief Legal Officer. Source: Newmont leadership update.
Valuation Changes for Newmont
- Fair value shifted from $177.00 to $168.00, which represents a modest reduction in the analyst fair value estimate for Newmont.
- The discount rate moved from 8.19% to 8.84%, which means analysts are now applying a slightly higher required return to Newmont's cash flows.
- The revenue growth assumption was adjusted from 16.37% to 15.66%, indicating a small change to the expected pace of future dollar revenue expansion in analyst models.
- Net profit margin increased from 43.09% to 49.03%, reflecting higher modeled profitability for Newmont in updated forecasts.
- The future P/E multiple decreased from 15.78x to 10.30x, which points to a lower valuation multiple being used in analyst projections for Newmont.
Key Takeaways
- Strategic portfolio integration, automation, and digitalization are driving substantial cost reductions and productivity gains, positioning Newmont for sustained margin and earnings growth.
- Early leadership in ESG initiatives is enhancing access to capital and customers, supporting premium valuation multiples and long-term industry leadership.
- Shifting market trends, rising regulatory pressures, declining ore quality, acquisition risks, and geopolitical exposure all threaten Newmont's future profitability and earnings stability.
Catalysts
About Newmont- Engages in the production and exploration of gold properties.
- Analysts broadly agree that gold's role as a safe-haven asset is strengthening in today's environment, but they may be understating the impact of accelerating global de-dollarization and record central bank gold purchases, which could drive gold prices well beyond current forecasts and structurally elevate Newmont's revenue and cash flow for years.
- While analyst consensus expects operational optimization and cost discipline to modestly improve margins, there is increasing evidence that Newmont's transformational portfolio integration and advanced automation are enabling a much more dramatic reduction in all-in sustaining costs, potentially unlocking multi-year EBITDA margin expansion and supporting significant earnings leverage to higher gold prices.
- Newmont's aggressive divestment of non-core assets, evidenced by $3 billion in expected after-tax proceeds this year, is rapidly enhancing capital efficiency and supporting an unparalleled capital return program, including a new $3 billion share repurchase-meaningfully accelerating per-share free cash flow and EPS growth beyond peer expectations.
- The ongoing digitalization and automation of Newmont's core operations, combined with the deep technical talent bench and best-in-class asset reliability initiatives, is setting the stage for sustained productivity gains and production stability, materially improving long-term operating leverage and reducing earnings volatility.
- As ESG requirements become an increasingly stringent gating factor for capital flows and customer contracts, Newmont's early and sustained investment in decarbonization, water management, and community engagement positions it as the "go-to" partner for institutional capital and premium global jewelry/technology clients, increasing access to low-cost funding and supporting higher valuation multiples over time.
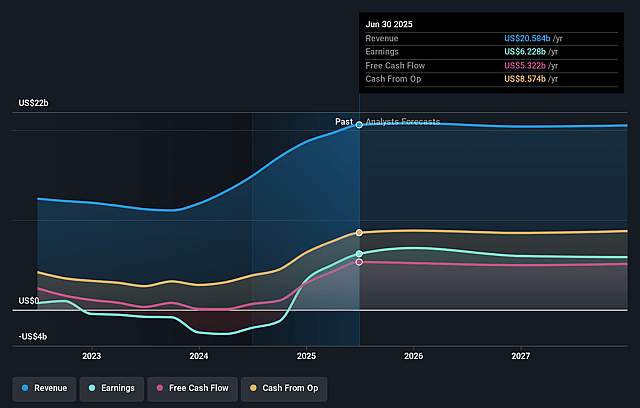
Newmont Future Earnings and Revenue Growth
Assumptions
How have these above catalysts been quantified?
- This narrative explores a more optimistic perspective on Newmont compared to the consensus, based on a Fair Value that aligns with the bullish cohort of analysts.
- The bullish analysts are assuming Newmont's revenue will grow by 15.7% annually over the next 3 years.
- The bullish analysts assume that profit margins will increase from 33.4% today to 49.0% in 3 years time.
- The bullish analysts expect earnings to reach $19.5 billion (and earnings per share of $18.97) by about August 2029, up from $8.6 billion today. However, there is some disagreement amongst the analysts with the more bearish ones expecting earnings as low as $9.3 billion.
- In order for the above numbers to justify the price target of the more bullish analyst cohort, the company would need to trade at a PE ratio of 10.3x on those 2029 earnings, down from 14.3x today. This future PE is lower than the current PE for the US Metals and Mining industry at 18.4x.
- The bullish analysts expect the number of shares outstanding to decline by 4.07% per year for the next 3 years.
- To value all of this in today's terms, we will use a discount rate of 8.84%, as per the Simply Wall St company report.
Risks
What could happen that would invalidate this narrative?- The accelerating global energy transition and the rise of digital currencies may reduce gold's appeal as a long-term store of value, which could diminish bullion demand and pressure Newmont's future revenues and cash flows.
- Increasing ESG scrutiny and rising regulatory expectations around environmental and social impact could drive up Newmont's ongoing compliance and permitting costs, reducing net margins and putting pressure on profitability over the next decade.
- Declining average ore grades at key mines such as Cadia and Peñasquito, as stated in the company's outlook for lower gold grades in the coming quarters, will drive up extraction costs and could erode Newmont's profitability and net income over time.
- The operational challenges and integration risks from recent large-scale acquisitions-including the ongoing rationalization of Newcrest's assets-may strain efficiency and limit the return on invested capital, adversely impacting earnings growth in the medium to long term.
- Newmont's significant exposure to geopolitical and jurisdictional risk, with mining assets in countries prone to regulatory changes, higher taxes, or social unrest, could lead to production disruptions, asset write-downs, or higher tax burdens, directly affecting revenue stability and earnings quality.
Valuation
How have all the factors above been brought together to estimate a fair value?
- The assumed bullish price target for Newmont is $168.0, which represents up to two standard deviations above the consensus price target of $130.36. This valuation is based on what can be assumed as the expectations of Newmont's future earnings growth, profit margins and other risk factors from analysts on the bullish end of the spectrum.
- However, there is a degree of disagreement amongst analysts, with the most bullish reporting a price target of $168.0, and the most bearish reporting a price target of just $67.0.
- In order for you to agree with the more bullish analyst cohort, you'd need to believe that by 2029, revenues will be $39.9 billion, earnings will come to $19.5 billion, and it would be trading on a PE ratio of 10.3x, assuming you use a discount rate of 8.8%.
- Given the current share price of $117.26, the analyst price target of $168.0 is 30.2% higher.
- We always encourage you to reach your own conclusions though. So sense check these analyst numbers against your own assumptions and expectations based on your understanding of the business and what you believe is probable.
Have other thoughts on Newmont?
Create your own narrative on this stock, and estimate its Fair Value using our Valuator tool.
Create NarrativeHow well do narratives help inform your perspective?
Comments
0 commentsDisclaimer
AnalystHighTarget is a tool utilizing a Large Language Model (LLM) that ingests data on consensus price targets, forecasted revenue and earnings figures, as well as the transcripts of earnings calls to produce qualitative analysis. The narratives produced by AnalystHighTarget are general in nature and are based solely on analyst data and publicly-available material published by the respective companies. These scenarios are not indicative of the company's future performance and are exploratory in nature. Simply Wall St has no position in the company(s) mentioned. Simply Wall St may provide the securities issuer or related entities with website advertising services for a fee, on an arm's length basis. These relationships have no impact on the way we conduct our business, the content we host, or how our content is served to users. The price targets and estimates used are consensus data, and do not constitute a recommendation to buy or sell any stock, and they do not take account of your objectives, or your financial situation. Note that AnalystHighTarget's analysis may not factor in the latest price-sensitive company announcements or qualitative material.


