
Last Update 03 Sep 26
Fair value Increased 4.26%PLXS: Share Repurchases And Reaffirmed Thesis Will Support Further Upside
Analysts have lifted their Plexus price target from $293.25 to $305.75, pointing to updated expectations around revenue growth, profit margin and long term earnings multiples after recent management meetings reaffirmed key elements of the investment case.
What’s in the News for Plexus
- Plexus Corp. announced a share repurchase program authorizing the company to buy back up to US$100 million of its stock. Source, Buyback Transaction Announcements.
- The Board of Directors of Plexus Corp. approved a buyback plan on August 20, 2026. Source, Buyback Transaction Announcements.
- From April 5, 2026 to July 4, 2026, Plexus repurchased 79,707 shares for US$20.62 million, representing 0.3% of shares. This completed a total repurchase of 454,400 shares for US$78.63 million, representing 1.69% of shares under the buyback that was announced on May 14, 2025. Source, Buyback Tranche Update.
- Plexus issued earnings guidance for the fourth quarter of fiscal 2026 and for fiscal years 2026 and 2027, including revenue, GAAP diluted EPS and operating margin ranges, and commentary on expected revenue growth and operating margin expansion. Source, Corporate Guidance, New or Confirmed.
- Plexus Corp. was removed from several Russell value and small cap related benchmarks, including the Russell 3000E Value, Russell 2500 Value, Russell 2000 Value, Russell Small Cap Comp Value and Russell 3000 Value benchmarks. Source, Index Constituent Drops.
Valuation Changes for Plexus
- Fair Value was raised from $293.25 to $305.75, which is a modest upward adjustment in the Plexus valuation.
- The Discount Rate moved slightly higher from 8.80% to 8.95%, indicating a marginally higher required return in the updated model.
- The assumed Revenue Growth rate increased from 11.83% to 13.02%, reflecting higher expectations for future dollar revenue expansion for Plexus.
- The Net Profit Margin was adjusted from 4.62% to 4.88%, pointing to a small uplift in expected earnings efficiency on each dollar of sales.
- The Future P/E was reduced from 35.27x to 31.74x, which implies a lower multiple applied to Plexus earnings in the updated assessment.
Key Takeaways
- Focus on high-growth, complex sectors and value-added services is driving a shift toward higher-margin, long-term contracts and stronger revenue consistency.
- Global facility expansion and strong cash flow position Plexus to capitalize on sector trends, supporting sustained revenue growth and enhanced shareholder returns.
- Plexus faces revenue and margin volatility due to demand uncertainties, sector cyclicality, customer concentration, rising costs, and intensifying industry competition.
Catalysts
About Plexus- Provides electronic manufacturing services in the United States and internationally.
- Plexus is capitalizing on the growing demand for advanced electronics manufacturing fueled by digital transformation, IoT expansion, and emerging technologies like AI and connected vehicles, as reflected in a robust pipeline of new program wins across high-growth sectors-this is likely to drive sustained multi-year revenue growth and larger addressable markets.
- Strategic expansion and high utilization of global facilities, particularly the new Malaysia site (with initial focus on semicap and planned healthcare ramp), positions the company to meet increased demand both from reshoring/regionalization trends and sector-specific growth, which should support ongoing revenue gains and improved asset turnover.
- The company's increasing success in winning programs in high-margin, complex sectors such as healthcare/life sciences, aerospace, and defense (including strong defense pipeline in Europe and record sector wins), is shifting the revenue mix toward segments with higher pricing power and more stable, long-term contracts-this should positively impact both revenue consistency and net margin expansion.
- Continued investment and strong performance in high-value engineering and design services (now exceeding $100 million, growing, and diversified across more sectors), is allowing Plexus to move up the value chain, resulting in larger contract sizes, enhanced customer stickiness, and higher gross margins.
- Robust free cash flow generation and improved working capital efficiency have enabled greater returns to shareholders and provide Plexus with flexibility for further growth investments, supporting long-term earnings expansion.
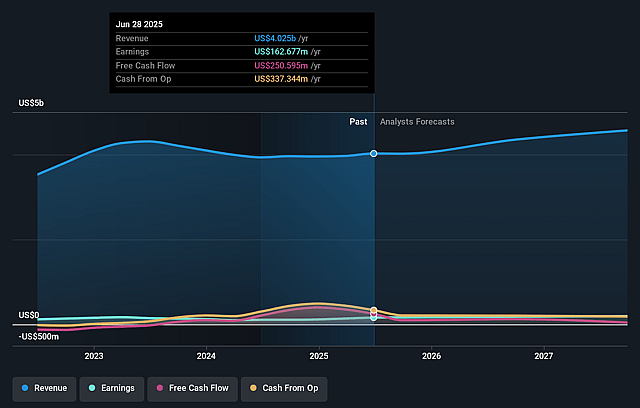
Plexus Future Earnings and Revenue Growth
Assumptions
How have these above catalysts been quantified?
- Analysts are assuming Plexus's revenue will grow by 13.0% annually over the next 3 years.
- Analysts assume that profit margins will increase from 4.0% today to 4.9% in 3 years time.
- Analysts expect earnings to reach $323.9 million (and earnings per share of $12.09) by about September 2029, up from $185.4 million today. The analysts are largely in agreement about this estimate.
- In order for the above numbers to justify the price target of the analysts, the company would need to trade at a PE ratio of 32.1x on those 2029 earnings, down from 34.4x today. This future PE is greater than the current PE for the US Electronic industry at 29.2x.
- Analysts expect the number of shares outstanding to decline by 0.46% per year for the next 3 years.
- To value all of this in today's terms, we will use a discount rate of 8.95%, as per the Simply Wall St company report.
Risks
What could happen that would invalidate this narrative?- Ongoing tariff-related uncertainties and rising protectionism lead customers to remain in a wait-and-see mode, which could dampen order activity and create unpredictability in revenue growth for Plexus over the long term (impact: revenue volatility and slower top-line growth).
- Customer-specific demand pushouts in high-growth verticals like semicap (now forecasting low double-digit growth instead of mid-teens), as well as flat outlooks in Aerospace, highlight Plexus's vulnerability to cyclical and program-driven fluctuations in its key sectors (impact: revenue instability and potential earnings variability).
- High customer concentration and a heavy reliance on large contract ramp-ups (notably in sectors such as healthcare and aerospace/defense) as well as the need for continuous new customer onboarding increase the risk that order reductions or delays from a few key customers could destabilize results (impact: revenue concentration risk and potential margin pressure).
- The anticipated margin drag from startup facilities (e.g., new Malaysian plant) and ongoing integration costs, combined with the long-term threat of margin compression from global competition and potential cost inflation in materials and labor, may erode profitability and limit sustained operating margin expansion (impact: net margin compression and lower earnings growth).
- The commoditization trend in the electronics manufacturing services industry, coupled with potential further consolidation among large OEMs, could increase price-based competition and bargaining power against mid-sized providers like Plexus, putting sustained pressure on both revenue and margins (impact: industry margin erosion and profit pressure).
Valuation
How have all the factors above been brought together to estimate a fair value?
- The analysts have a consensus price target of $305.75 for Plexus based on their expectations of its future earnings growth, profit margins and other risk factors.
- However, there is a degree of disagreement amongst analysts, with the most bullish reporting a price target of $330.0, and the most bearish reporting a price target of just $275.0.
- In order for you to agree with the analysts, you'd need to believe that by 2029, revenues will be $6.6 billion, earnings will come to $323.9 million, and it would be trading on a PE ratio of 32.1x, assuming you use a discount rate of 8.9%.
- Given the current share price of $239.29, the analyst price target of $305.75 is 21.7% higher.
- We always encourage you to reach your own conclusions though. So sense check these analyst numbers against your own assumptions and expectations based on your understanding of the business and what you believe is probable.
Have other thoughts on Plexus?
Create your own narrative on this stock, and estimate its Fair Value using our Valuator tool.
Create NarrativeHow well do narratives help inform your perspective?
Comments
0 commentsDisclaimer
AnalystConsensusTarget is a tool utilizing a Large Language Model (LLM) that ingests data on consensus price targets, forecasted revenue and earnings figures, as well as the transcripts of earnings calls to produce qualitative analysis. The narratives produced by AnalystConsensusTarget are general in nature and are based solely on analyst data and publicly-available material published by the respective companies. These scenarios are not indicative of the company's future performance and are exploratory in nature. Simply Wall St has no position in the company(s) mentioned. Simply Wall St may provide the securities issuer or related entities with website advertising services for a fee, on an arm's length basis. These relationships have no impact on the way we conduct our business, the content we host, or how our content is served to users. The price targets and estimates used are consensus data, and do not constitute a recommendation to buy or sell any stock, and they do not take account of your objectives, or your financial situation. Note that AnalystConsensusTarget's analysis may not factor in the latest price-sensitive company announcements or qualitative material.
Read more narratives

Semicap And Aerospace Slowdowns Will Pressure Margins And Constrain Future Cash Generation
View narrative
Aerospace And Defense Outsourcing Wave Will Support Stronger Long Term Outlook
View narrative