
Last Update 02 Jun 26
Fair value Increased 43%VRT: AI Data Center Backlog And Liquid Cooling Expansion Will Drive Upside
Analysts have raised their price target for Vertiv Holdings Co. from $263.20 to $376.80, citing updated assumptions for revenue growth, profit margins, and future P/E that are now reflected in their refreshed valuation model.
What's in the News
- Vertiv reported Q1 2026 net sales of about US$2.65b with roughly 30% year over year growth and adjusted diluted EPS of US$1.17. The company raised full year 2026 net sales guidance to US$13.5b to US$14.0b and guided to adjusted EPS growth of about 51% to 66%, supported by a backlog above US$15b. Source: Vertiv Q1 2026 results
- The company acquired Strategic Thermal Labs LLC to deepen its liquid cooling capabilities for AI and high performance computing data centers, adding expertise in cold plate design, server side liquid cooling and high density thermal validation. Source: Vertiv acquisition of Strategic Thermal Labs
- Vertiv expanded its partnership with Nvidia, rolling out Vertiv OneCore Rubin DSX prefabricated AI factory systems and SmartRun digital twin tools integrated with Nvidia Omniverse DSX. The initiative is aimed at helping data center customers model power and cooling before deployment. Source: Vertiv Nvidia partnership
- Management held a two day Investor Conference in May 2026, outlining a backlog of US$12.45b, operating margins at 20.8%, a margin target above 27% by 2030 and an active M&A program with US$3b to US$4b spent over four years and a bolt on range of US$750m to US$1b. Source: Vertiv 2026 Investor Conference
- Vertiv was added to the S&P 500 and several related S&P indices, and multiple banks, including Morgan Stanley, Citi, TD Cowen, RBC Capital, Roth Capital and Oppenheimer, raised price targets into a US$330 to US$435 range. Some investors pointed to valuation and insider selling as reasons for caution. Sources: Index changes and recent analyst reports
Valuation Changes
- Fair Value: updated from $263.20 to $376.80, indicating a higher assessed valuation level for the stock.
- Discount Rate: increased slightly from 9.35% to 9.76%, reflecting a modest change in the required return assumption.
- Revenue Growth: revised from 24.05% to 26.96%, indicating a higher assumed growth rate for future dollar revenue.
- Net Profit Margin: updated from 18.67% to 19.12%, reflecting a slightly higher assumed profitability level.
- Future P/E: raised from 36.54x to 45.79x, implying a higher valuation multiple applied to projected earnings.
Key Takeaways
- Surging AI-driven data center demand and expanding integration needs are boosting Vertiv's growth prospects and supporting higher pricing power.
- Strategic R&D, industry partnerships, and regulatory trends position Vertiv for sustained innovation and long-term earnings growth despite near-term operational challenges.
- Ongoing supply chain disruptions, regional execution challenges, and customer vertical integration threaten Vertiv's margins, revenue growth, and competitive positioning amid rapid technological change.
Catalysts
About Vertiv Holdings Co- Designs, manufactures, and services critical digital infrastructure technologies and life cycle services for data centers, communication networks, and commercial and industrial environments in the Americas, the Asia Pacific, Europe, the Middle East, and Africa.
- Accelerating global demand for high-density, AI-driven data centers is driving robust growth in Vertiv's sales pipeline and backlog, as evidenced by recurring record order levels, backlog growth, and management's raised organic sales growth guidance-supporting potentially higher future revenue.
- Increasing complexity and scale of data center deployments, including the need for integrated power and advanced liquid cooling solutions, are expanding Vertiv's addressable market and enabling premium pricing, which should support future net margin expansion as temporary operational costs normalize.
- Ongoing investments in R&D and engineering, highlighted by collaborations with industry leaders (e.g., CoreWeave, Dell, Oklo), position Vertiv to deliver next-generation solutions ahead of technology refresh cycles-creating recurring upgrade opportunities and sustaining top-line and earnings growth.
- Regulatory and policy momentum in the U.S. and EMEA is becoming more favorable for AI infrastructure build-outs, improving the long-term demand outlook and revenue visibility, especially as the current "coiled spring" in EMEA is poised to unwind and drive regional reacceleration.
- Operational and supply chain challenges-including costs tied to tariff transitions and rapid scaling-are expected by management to be largely resolved by the end of 2025, supporting management's long-term operating margin targets (25% by 2029) and stronger future earnings growth as scale benefits are fully realized.
Vertiv Holdings Co Future Earnings and Revenue Growth
Assumptions
How have these above catalysts been quantified?
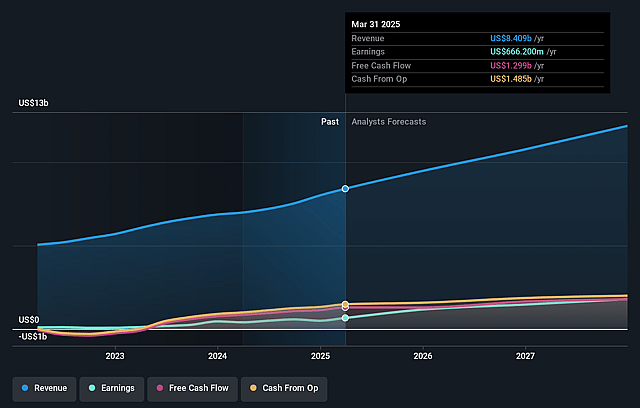
- Analysts are assuming Vertiv Holdings Co's revenue will grow by 27.0% annually over the next 3 years.
- Analysts assume that profit margins will increase from 14.4% today to 19.1% in 3 years time.
- Analysts expect earnings to reach $4.2 billion (and earnings per share of $11.03) by about June 2029, up from $1.6 billion today. However, there is some disagreement amongst the analysts with the more bullish ones expecting earnings as high as $5.0 billion.
- In order for the above numbers to justify the price target of the analysts, the company would need to trade at a PE ratio of 45.9x on those 2029 earnings, down from 79.7x today. This future PE is greater than the current PE for the US Electrical industry at 40.1x.
- Analysts expect the number of shares outstanding to grow by 0.59% per year for the next 3 years.
- To value all of this in today's terms, we will use a discount rate of 9.76%, as per the Simply Wall St company report.
Risks
What could happen that would invalidate this narrative?- Intensifying global trade tensions and frequently changing tariffs are creating ongoing supply chain and manufacturing disruptions, leading to higher transition costs and operational inefficiencies that can compress net margins and pressure future earnings.
- The company's continued reliance on margin expansion from operational efficiencies is challenged by temporary but recurring execution issues, including cost overruns from supply chain reconfiguration and growth acceleration, which may result in lower-than-expected margin improvement and weigh on long-term earnings growth.
- Ongoing execution challenges in EMEA, compounded by flat sales forecasts and upfront investments in anticipation of future demand, create a risk that regional underperformance may persist, dragging on overall revenue growth and regional profitability.
- The risk of hyperscale and large cloud customers pursuing vertical integration or developing in-house cooling and power solutions could diminish Vertiv's ability to maintain win rates and may ultimately compress revenues and reduce market share over time.
- Rapid technological change in the data center sector means Vertiv must sustain high R&D spending and product innovation; failure to keep up with next-generation cooling/power technologies or an inability to differentiate amid increasing commoditization can erode pricing power, compress margins, and limit long-term earnings potential.
Valuation
How have all the factors above been brought together to estimate a fair value?
- The analysts have a consensus price target of $376.8 for Vertiv Holdings Co based on their expectations of its future earnings growth, profit margins and other risk factors.
- However, there is a degree of disagreement amongst analysts, with the most bullish reporting a price target of $500.0, and the most bearish reporting a price target of just $236.0.
- In order for you to agree with the analysts, you'd need to believe that by 2029, revenues will be $22.2 billion, earnings will come to $4.2 billion, and it would be trading on a PE ratio of 45.9x, assuming you use a discount rate of 9.8%.
- Given the current share price of $323.39, the analyst price target of $376.8 is 14.2% higher.
- We always encourage you to reach your own conclusions though. So sense check these analyst numbers against your own assumptions and expectations based on your understanding of the business and what you believe is probable.
Have other thoughts on Vertiv Holdings Co?
Create your own narrative on this stock, and estimate its Fair Value using our Valuator tool.
Create NarrativeHow well do narratives help inform your perspective?
Comments
2 commentsDisclaimer
AnalystConsensusTarget is a tool utilizing a Large Language Model (LLM) that ingests data on consensus price targets, forecasted revenue and earnings figures, as well as the transcripts of earnings calls to produce qualitative analysis. The narratives produced by AnalystConsensusTarget are general in nature and are based solely on analyst data and publicly-available material published by the respective companies. These scenarios are not indicative of the company's future performance and are exploratory in nature. Simply Wall St has no position in the company(s) mentioned. Simply Wall St may provide the securities issuer or related entities with website advertising services for a fee, on an arm's length basis. These relationships have no impact on the way we conduct our business, the content we host, or how our content is served to users. The price targets and estimates used are consensus data, and do not constitute a recommendation to buy or sell any stock, and they do not take account of your objectives, or your financial situation. Note that AnalystConsensusTarget's analysis may not factor in the latest price-sensitive company announcements or qualitative material.
Read more narratives

Cloud And AI Growth Will Drive Energy Efficient Data Centers
View narrative
The Short and Long Term Compounder of Liquid Cooling industry.
View narrative

Everyone's Favorite Stock Just Fell 17% in a Day. It Still Isn't Cheap.
View narrative
AI Adoption And Supply Chain Realignment Will Secure Future Stability
View narrative